Chapter 2 Get around in R
2.1 RStudio interface
Figure 2.1: RStudio Interface (Source: cdhowe, RStudio IDE screenshot, altered by Marcel Reinmuth, CC BY-SA 4.0
Source / Script
The Source panel in the top left corner consists of your R source code.
It is basically a top-down chain of R commands that make up your workflow.
With the run button on the top right, you can either:
- run the whole script at once
- run a single line of code. Locate your cursor in the line you want to run and hit run or press [ctrl] + [enter]
- run multiple lines. To do this you need to highlight the lines and hit run or press [ctrl] + [enter].
Console
Every line that is run will be written to the Console. This is the place were the execution of your code actually happens.
On the second tab of the console window at the bottom left is the Terminal.
The terminal acts as a command line interface, you can run operating system specific commands here.
The Jobs tab lists all R operations in the background, e.g. entire script runs, which are independent of your current development.
Environment / History
The Environment panel on the top right lists all variables and functions that are defined in your project.
Some variables like dataframes or tables can be manually inspected within RStudio.
The History tab lists all commands that were executed within your project.
Files/Plots/Packages/Help
The panel on the bottom right consists of the following tabs:
Files: a file explorer with some functions to create new folders, delete and rename files. For some data formats like.csvand.xlsxa graphical user interface can be started from there to facilitate the import.Plots: all plots generated with different packages will be end up in this tab.Packages: all packages that are locally installed and their version. Indicators hints for which packages a upgrade is available.Help: documentation for all installed packages. You can either use the search bar to find packages or functions you are interested in, or you type?in front of a function to automatically open the corresponding documentation:?read.csv()
2.2 Paths and .Rproj
Working with R involves working with data. These need to be loaded into R - therefore, we need to tell R where to find the data. Likewise, if we want to save the output of an analysis somewhere, we need to specify the location. Input and output data in R are accessed via paths. A dataset resides in a specific location on your hard drive in a folder structure. Likewise, R is executed at a specific location embedded in a folder structure. To load the desired dataset into R, the path to it must be defined correctly. There are two types of paths:
- absolute paths and
- relative paths
Given is the following example project file structure:
spatial_data_science/
├── notes.docx
├── spatial_data_science.Rproj
├── data
│   ├── acled_example.xlsx
│   ├── covid19_incidence_kreise.xlsx
│   ├── meuse.dbf
│   └── osm_bw.gpkg
└── src
    ├── exercise_1.Rmd
    ├── exercise_2.Rmd
    └── exercise_3.Rmd
Absolute paths start from the root of the file system. On a windows machine an absolute path looks like this:
c:/Documents and users/Desktop/Uni_stuff/classes/spatial_data_science/data/covid19_incidence_kreise.xlsx
Relative paths start from a location a program is currently running. In the following example, a program like R is running at the absolute path:
c:/Documents and users/Desktop/Uni_stuff/classes/spatial_data_science/src/
A relative path to the covid19 dataset looks like this: ../data/covid19_incidence_kreise.xlsx
The ../ indicates moving one folder level up from the current location.
Hint: Windows specifies paths with the backslash *. However, a path specified with backslahs will not work in R. You need to use the slash /* or a double backslash \ instead.
c:/Documents and users/Desktop/Uni_stuff/classes/spatial_data_science/data/covid19_incidence_kreise.xlsxworks finec:\Documents and users\Desktop\Uni_stuff\classes\spatial_data_science\data\covid19_incidence_kreise.xlsxdoes not workc:\\Documents and users\\Desktop\\Uni_stuff\\classes\\spatial_data_science\\data\\covid19_incidence_kreise.xlsxworks fine.
To check in which location the current R environment is running use the command getwd().
To change it, use setwd().
However it is bad practice to hard-code paths.
A modern RStudio setup uses a project file (.Rproj) to define the working directory.
In our example folder structure this would be the root folder of the course: spatial_data_science.
Every script used in the project should make use of relative paths to input and output data.
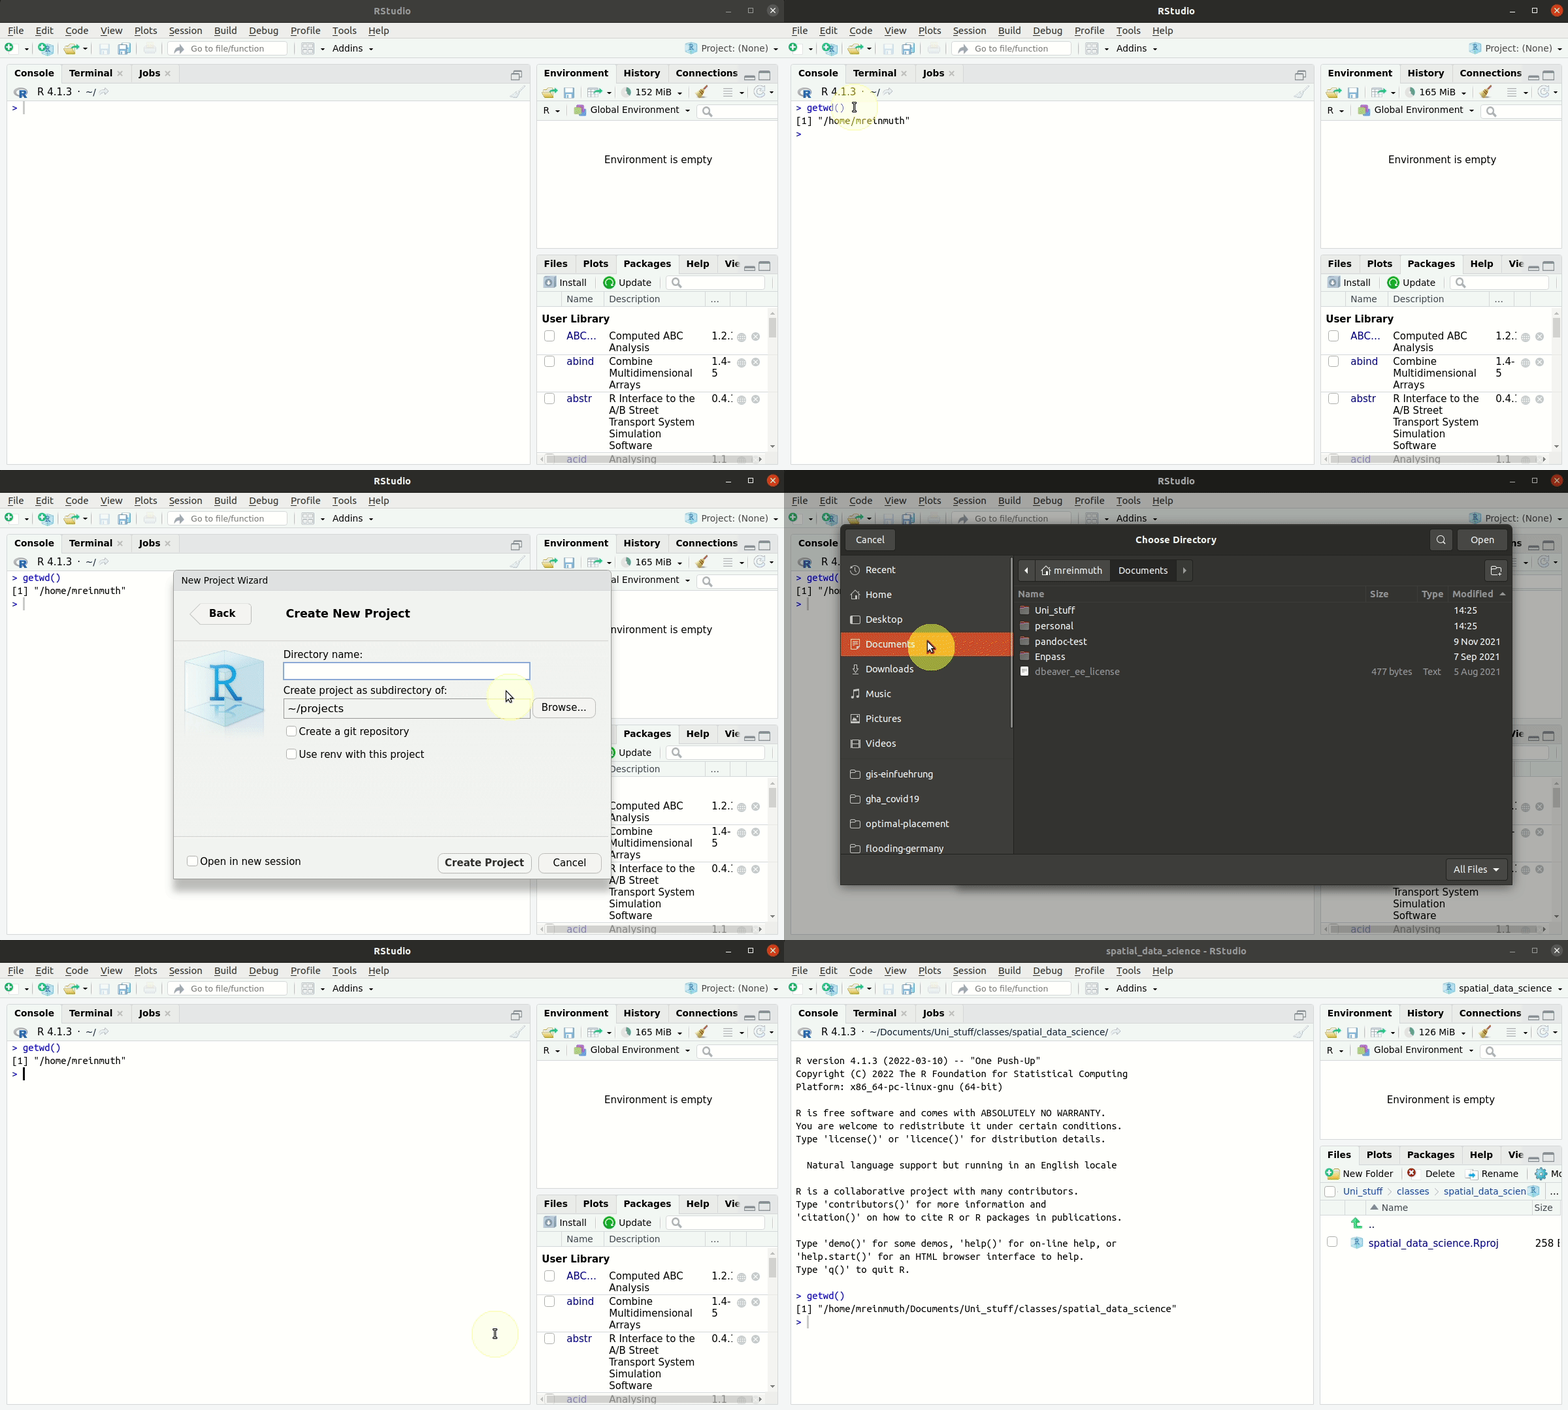
The following .gif shows how to create a R project from scratch:

Figure 2.2: How to create a R project in RStudio
2.3 Rmarkdown
For the exercises and assignments of this class we use R Markdown files.
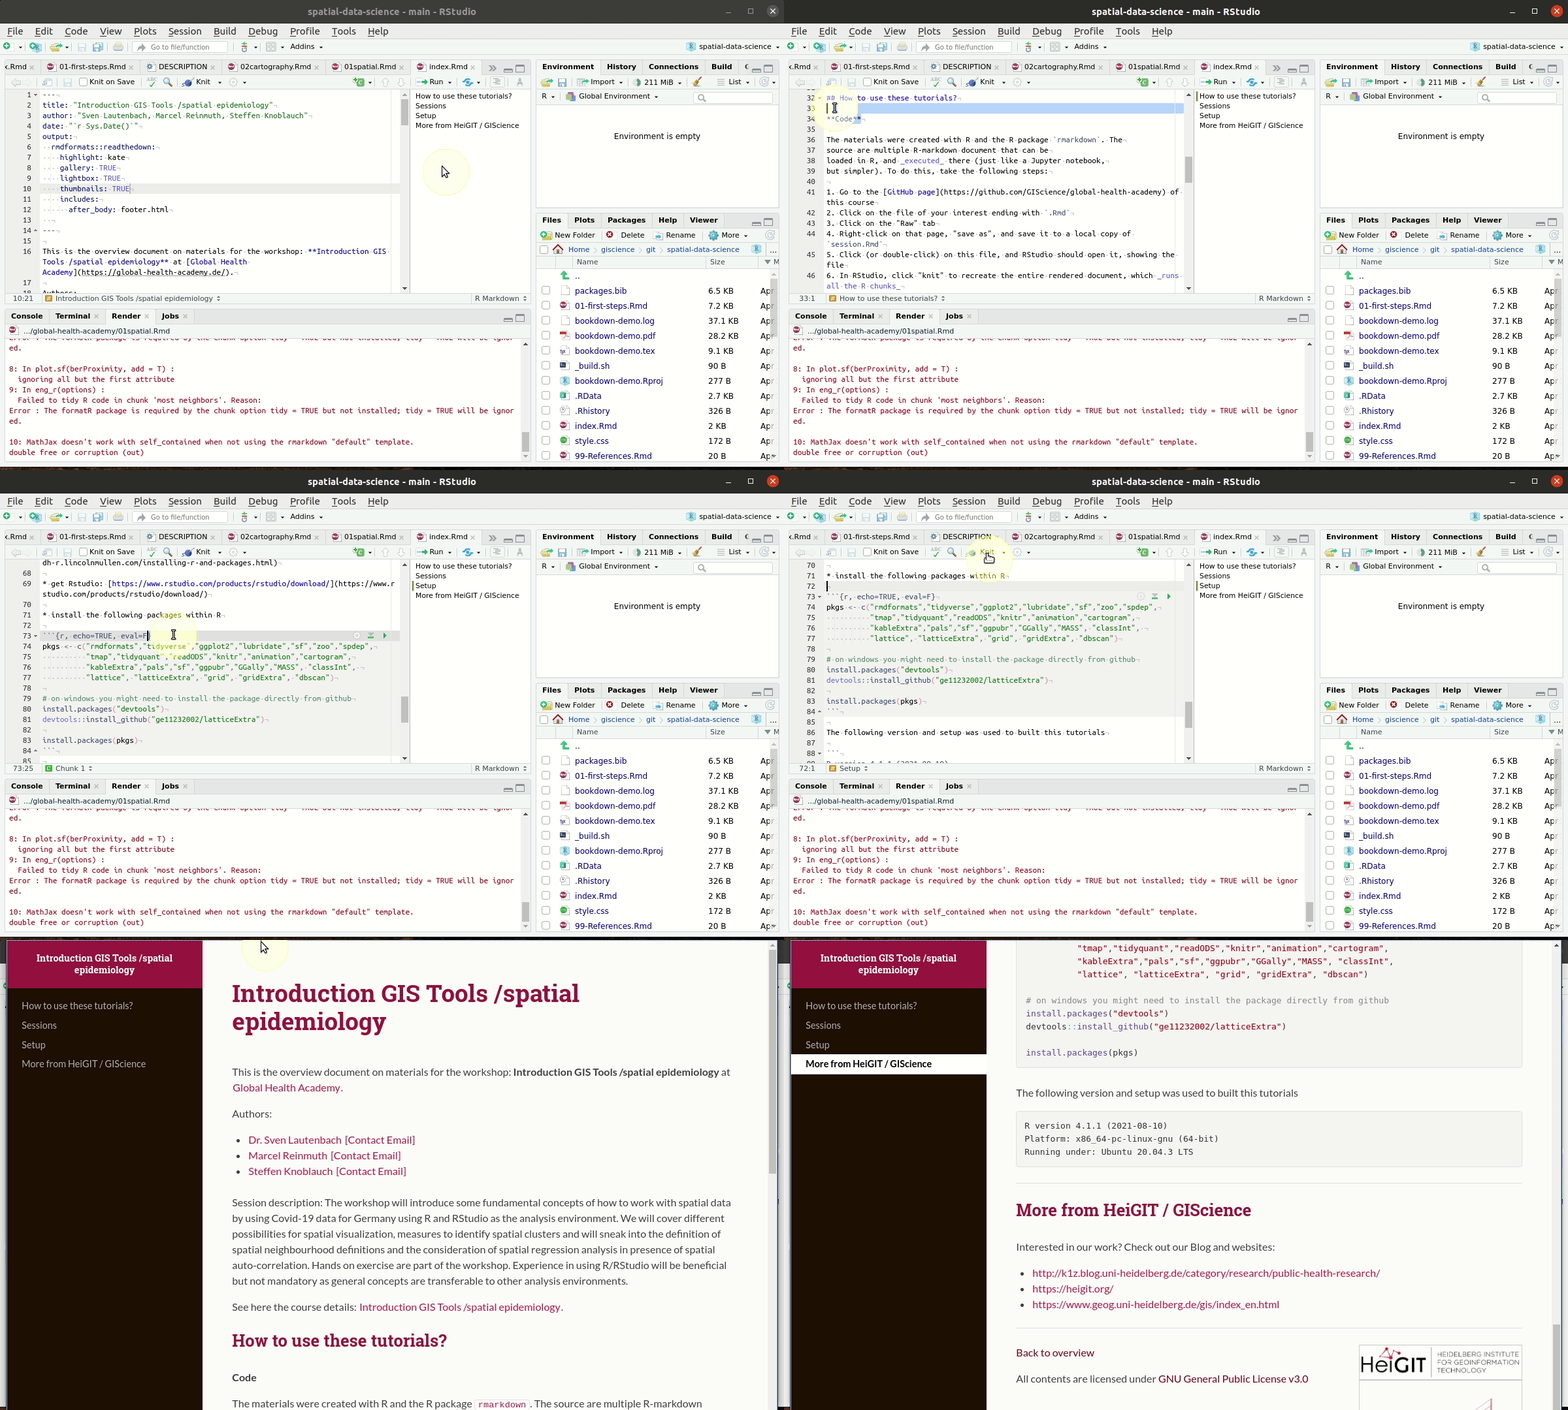
R Markdown files combine markdown text, R code, results like printed text or figures and other media formats.
R Markdown files can be compiled into pdf, docx and html via the knit function.
More on the R Markdown Syntax can be found here: https://rmarkdown.rstudio.com/lesson-1.html.
A general overview on Markdown Syntax can be found here: https://www.markdownguide.org/basic-syntax/

Figure 2.3: R Markdown Source file, knitting and result in html
The general structure of an Rmarkdown file is as follows:
- a YAML header which specifies the author, the title, the name, the outputformat,…
- code chunks that contain R-code to be executed
- normal text that can be formated with the Markdown language
- in addition it is possible to include equations in LaTeX syntax and many more things that are beyond the scope of this course
2.4 Further ressources
How to get help when stuck?
Look up the functions documentation with
?<function name>within RStudioRead through the vignettes of the package you are trying to use / understand. A vignette is a kind of long-form guide on the main functions and use cases of a package. It is a very convinient way of getting into the functionality of a package. Here is an example vignette of the
sfpackage. It contains all information on the package development, like author, github page and version number. How to install it and troubleshoot installations. References to the packages functions (these are the same documentations that are found via?inside RStudio). But the best part can be found underArticles. There you will find application examples of the most important functionalities and explanations about the philosophy of the package.Google it. R is a very popular software with a big community. The problems you will encounter have probably already been encountered by others and discussed online. If you google a problem make sure to use the right terms. Here is an example to get infos on how to join data frames based on two or more columns:
R how to join two tables based on multiple columns?
Most likely such a google search will bring you on either Stackexchange or Stackoverflow. Two very popular question and answer platforms. There are subpages for GIS and R-related questions. Answers to questions can be voted up and down by users and marked as a working solution by the questioner
- Cheatsheets are quite popular with the R community. There are cheatsheets on a couple of packages, here is a selection: