Exercise 06: Combine OSM and Copernicus EMS data#
Motivation#
What added value does OSM data offer for spatial analyses in the event of a disaster?
Information on the spatial dimension of an affected area, e.g. the extent of a flood, and the population distribution is usually not captured in OSM, but will be made available by public authorities or disaster management agencies. Nevertheless, in many cases it is not enough to know only the extent of the disaster; it is also necessary to assess its impact. When responding to a disaster or when planning for disaster risk reduction measures, the key question is often the estimation of the affected population or effects that infrastructure disruptions will have on regions outside the directly impacted regions. In these situations, a combination of multiple datasets (including OSM) is often used.
To reduce the severe consequences of natural hazards,the humanitarian system focuses on measures to reduce disaster risks. Relevant actions include risk analysis, disaster prevention and mitigation measures as well as measures for strengthening the preparedness of communities in most affected areas. […] An interesting approach lies with the increasing use of geoinformation services combined with the efforts of digital volunteers. Both have already proven to substantially support relief activities of humanitarian organizations, such as the mapping activities after the earthquake in Nepal in 2015 or during the Ebola epidemic in 2014/2015. [Scholz et al., 2018]
How many buildings have been damaged by the Ahrtal flood and how many people are affected?#
The 2021 Ahrtal flooding in Germany destroyed hundreds of buildings and countless streets in the affected areas or made them temporarily impassable. The German Red Cross was one of the organizations that provided disaster relief on the ground, as well as long-term assistance in the flood-affected regions. In the first days after the disaster, the German Red Cross literally had no numbers on how many people needed help. HeiGIT helped to coordinate resources based on the distribution of affected people by running GIS workflows that combined data from multiple sources such as Copernicus EMS and OpenStreetMap. In this exercise, you will replicate parts of this analysis we performed for the German Red Cross in 2021.
1. Download External Data#
Copernicus EMS provides near-real-time information and geodata about various natural disasters such as floods or earthquakes. In this exercise we use the data provided for activation EMSR517: Flood in Western Germany. In the aftermath of the Ahrtal flood Copernicus EMS created several products such as grading (damage classification) and delineation maps for the affected regions.
For the analysis we will use the Grading Product for Bad Neuenahr-Ahrweiler. Just get the .zip vector package.
For the first estimation of affected population we will use data from WorldPop for Germany. Download the 2020 100m Constrained Population Count dataset.
To estimate the number of affected people we will further use population information provided by the German Zensus 2011. We need to get the 1 kilometer grid geometries (“Karte eines 1 Kilometer-Gitters für Deutschland gemäß der INSPIRE Spezifikation”) and population values for the 1 kilometer grid (“Spitze Werte im 1 Kilometer-Gitter” im CSV-Format”).
Download the district boundary of the Landkreis Ahrweiler and all municipalities within it, from OSM Boundaries.
Finally, download all buildings mapped in OSM for the Landkreis Ahrweiler. Maybe add a small buffer of two kilometers, so that also buildings on the edge are included.
2. Estimate affected population using flood extent#
For this analysis we will use the flood delineation provided by Copernicus EMS. Here, we want to provide a quick estimate on how many people are affected by the flood per municipality.
Load the dataset with the flood extent and dissolve the individual polygons.
Show the steps in QGIS.
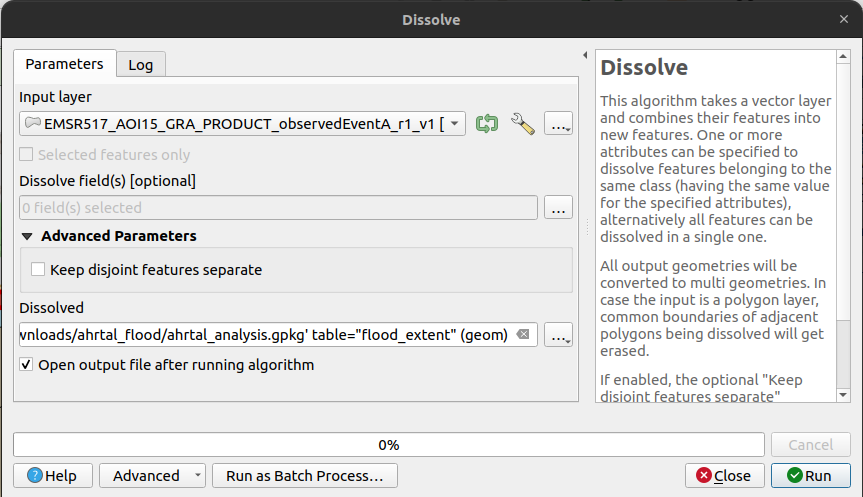
Fig. 30 Dissolve flood extent polygons.#
Intersect the flood extent with the municipality boundaries for the Landkreis Ahrweiler.
Show the steps in QGIS.
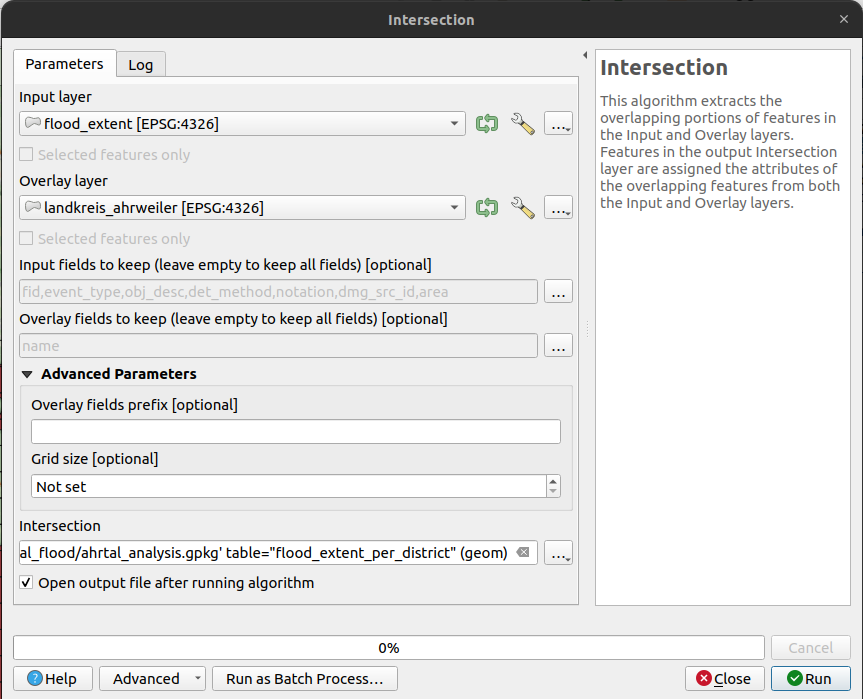
Fig. 31 Intersection of flood extent and municipality boundaries.#
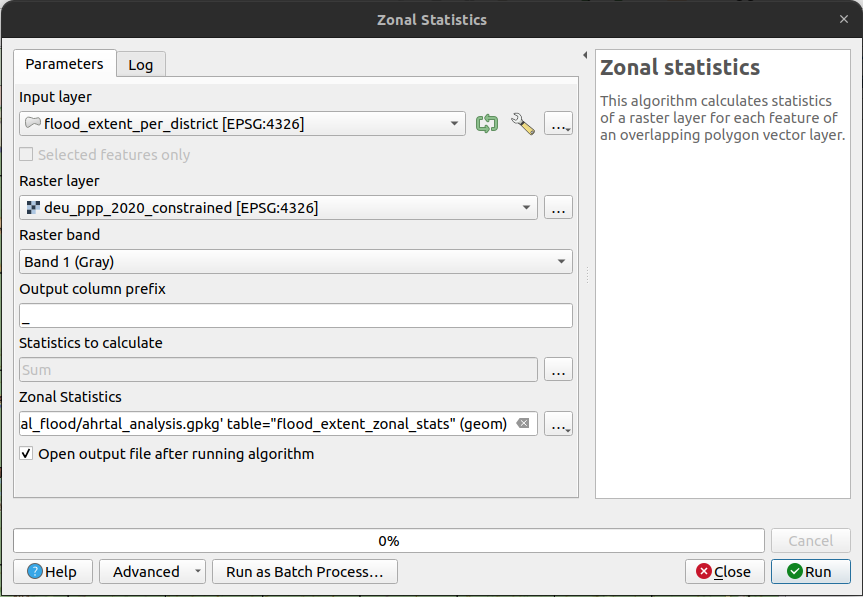
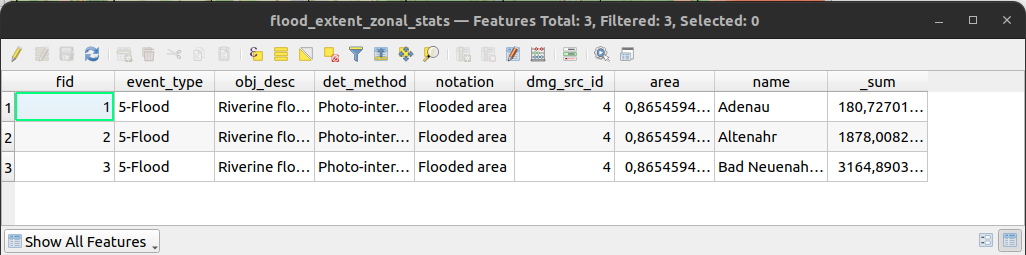
Finally, derive a rough estimate for the number of people affected by the flood per municipality using the Worldpop population data using the zonal stats tool.
3. Estimate affected population using building damage grades#
In this step, we want to derive the average number of people per building per Zensus Grid cell. First, join the population information from the Zensus Spreadsheet to the Zensus Grid geometries.
Show the steps in QGIS.
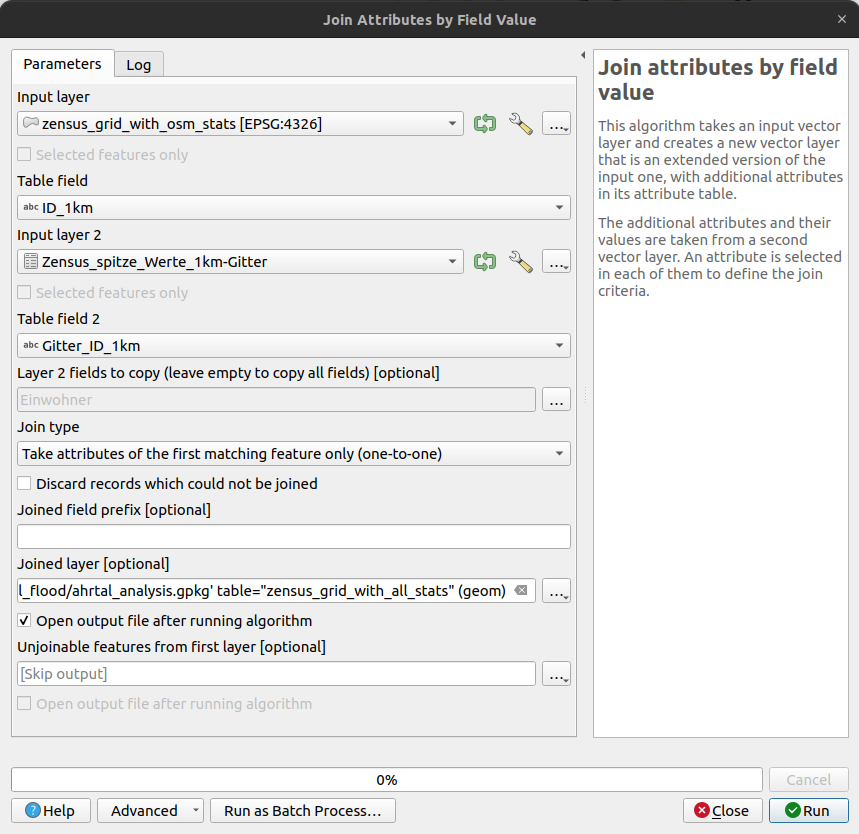
Fig. 34 Join Zensus grid geometries and population values from CSV file.#
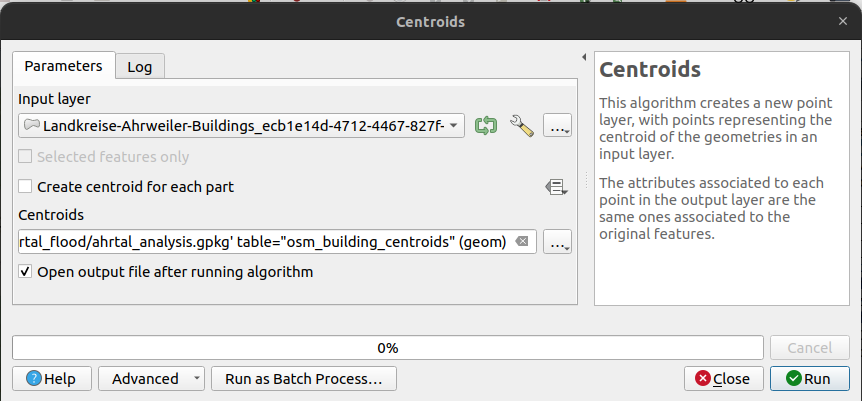
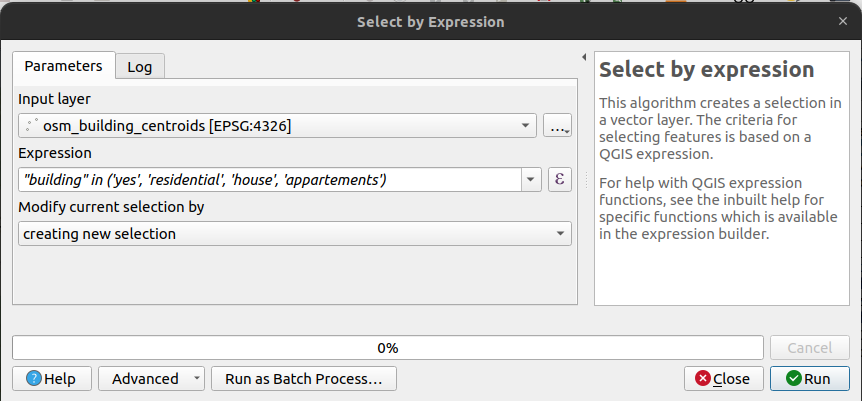
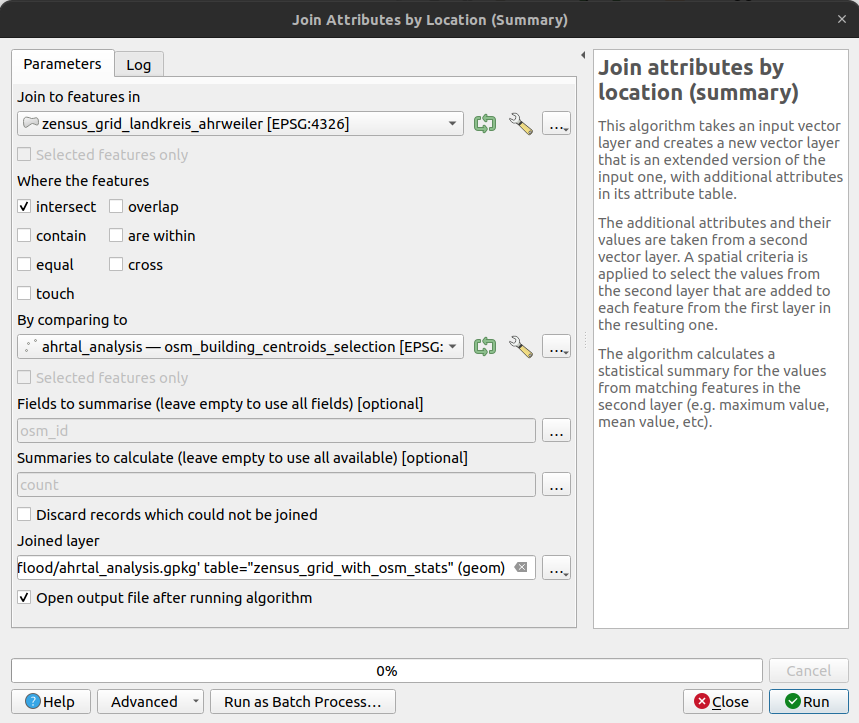
In a second, step count the number of residential buildings (values: yes, house, residential, appartements) per Zensus Grid cell (for simplicity use the building centroid here as the reference).
Show the steps in QGIS.
Then, use the Field Calculater to add the average people per buildings (grid population / grid building count).
Show the steps in QGIS.
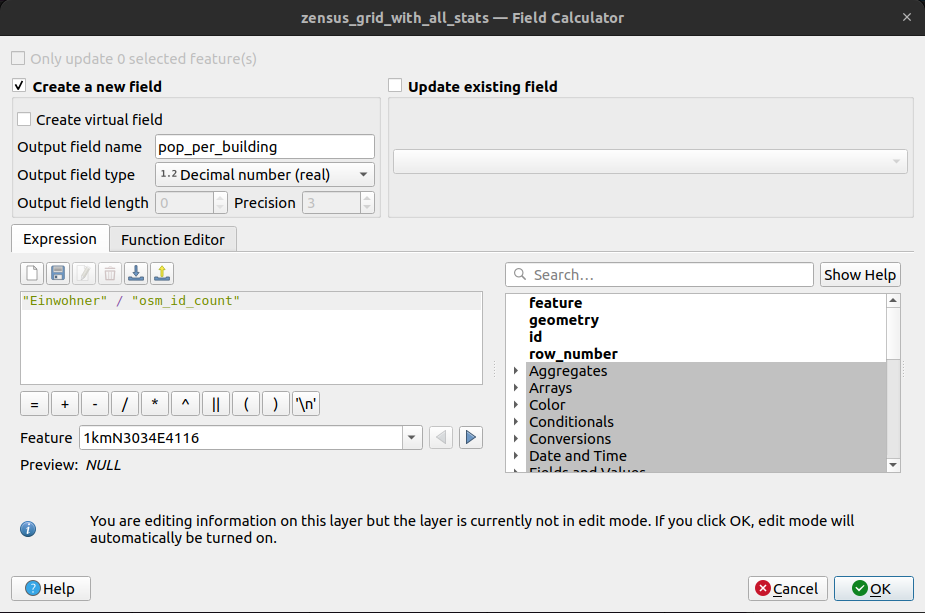
Fig. 38 Compute the average number of people per building for each Zensus grid geometry.#
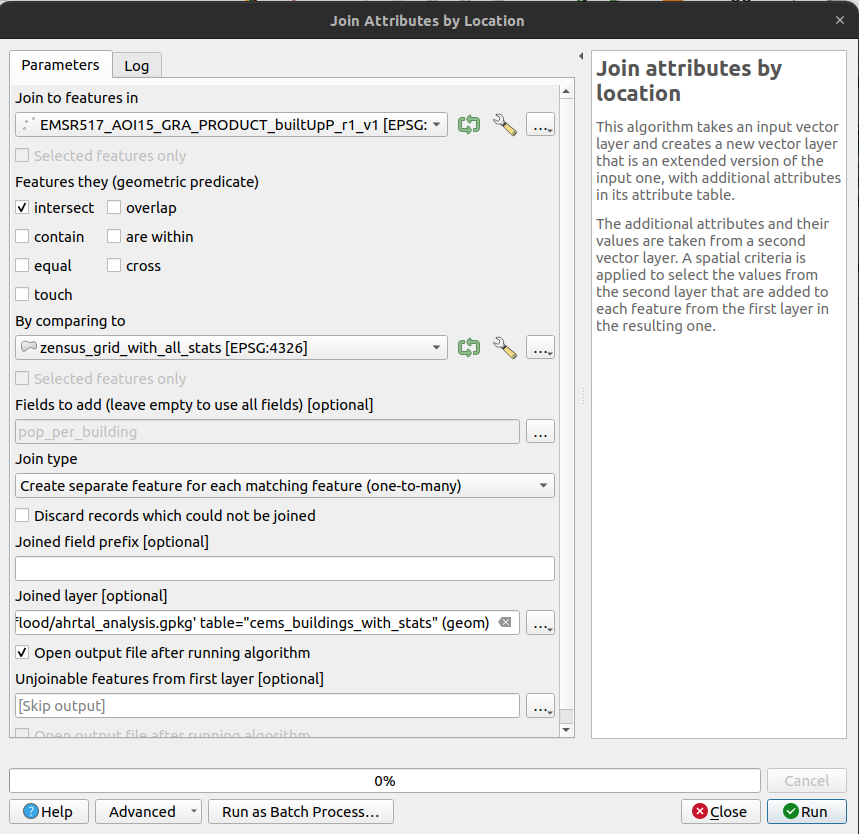
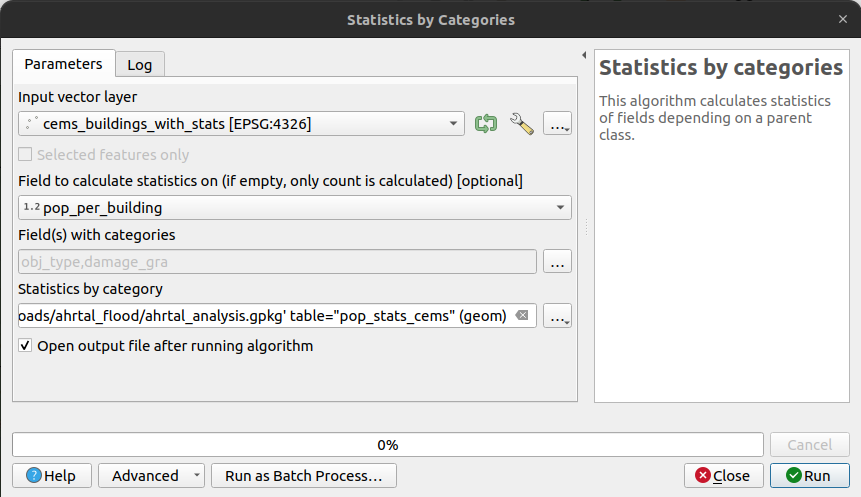
Finally, estimate the number of person which live in buildings which have been damaged or destroyed by the flood. Use a spatial join to add the population per building derived earlier to each damaged building as marked by Copernicus EMS. Then, derive summary population statistics per Copernicus EMS damage grade and object type.
Show the steps in QGIS.
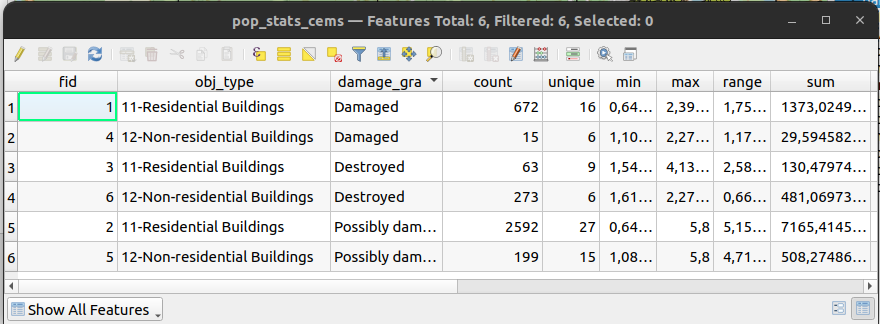
Note
This is a rather simple dasymetric mapping approach. You will very likely get non-integer values for the occupation per building, but let’s work with these numbers for now.