Exercise 01: Schools counts#
Motivation#
Many research about the OSM community looks at the data produced by volunteers around the world. Oftentimes these analyses are based on relatively simple statistics, such as counting OSM elements for different regions. [Neis et al., 2013] have performed an anlysis to compare urban areas around the globe. In this exercise we will calculate simple count statistics which would enable you to redo the analysis they did almost 10 years ago.
Volunteered Geographic Information (VGI) projects and their crowdsourced data have been the focus of a number of scientific analyses and investigations in recent years. Oftentimes the results show that the collaboratively collected geodata of one of the most popular VGI projects, OpenStreetMap (OSM), provides good coverage in urban areas when considering particular completeness factors. However, results can potentially vary significantly for different world regions.
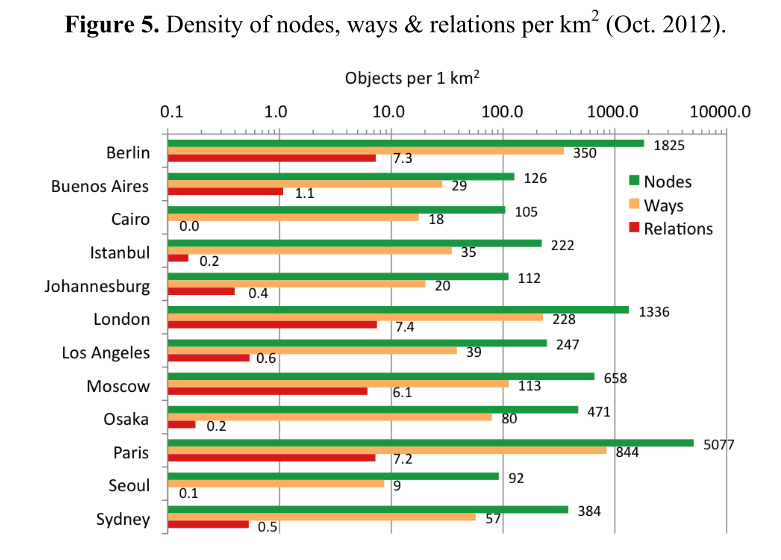
Fig. 1 OSM data density for selected world regions (source: [Neis et al., 2013])#
How many schools are mapped in OSM in Berlin?#
This exercise will investigate two questions:
How many schools are mapped as a node, way or relation in Berlin?
How are schools distributed across Berlin’s districts.
This kind of analysis can be answered using a snapshot of OSM data. Hence, there are many different options that lead to a result and OSM data can be downloaded from various websites. Note, that we are using Berlin here on purpose. If you try to run the same analysis for a much larger area (e.g. entire Germany or even Europe), this will get much harder for most and hardly possible for some approaches. This is even more important for the analysis of the roads. One lesson to keep in mind here: The scale of your analysis defines which tools and workflows you can use.
Document the steps and your results in a markdown file.
1. Check Tagging Guidelines in the OSM Wiki#
In a first step we will check how schools should be mapped in OSM. This information is usually available in the OSM Wiki. There we find:
Use amenity=school to identify a place where pupils, normally between the ages of about 6 and 18 are taught under the supervision of teachers. This includes, according to the ISCED: primary schools (ISCED 1, tagged with isced:level=1) and secondary schools (ISCED 2 and 3, tagged with isced:level=2;3), in some countries called high schools .
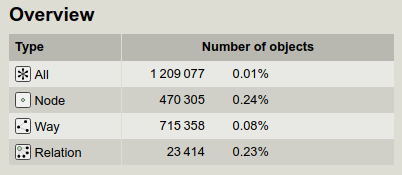
TagInfo has more insights about the usage of this tag for us. As of 2022-08-15 there have been about 1.2 Million elemets tagged as schools in OSM. We learn that most schools are either mapped as a node or way.
2. Get Insights about school counts using ohsome dashboard and overpass turbo#
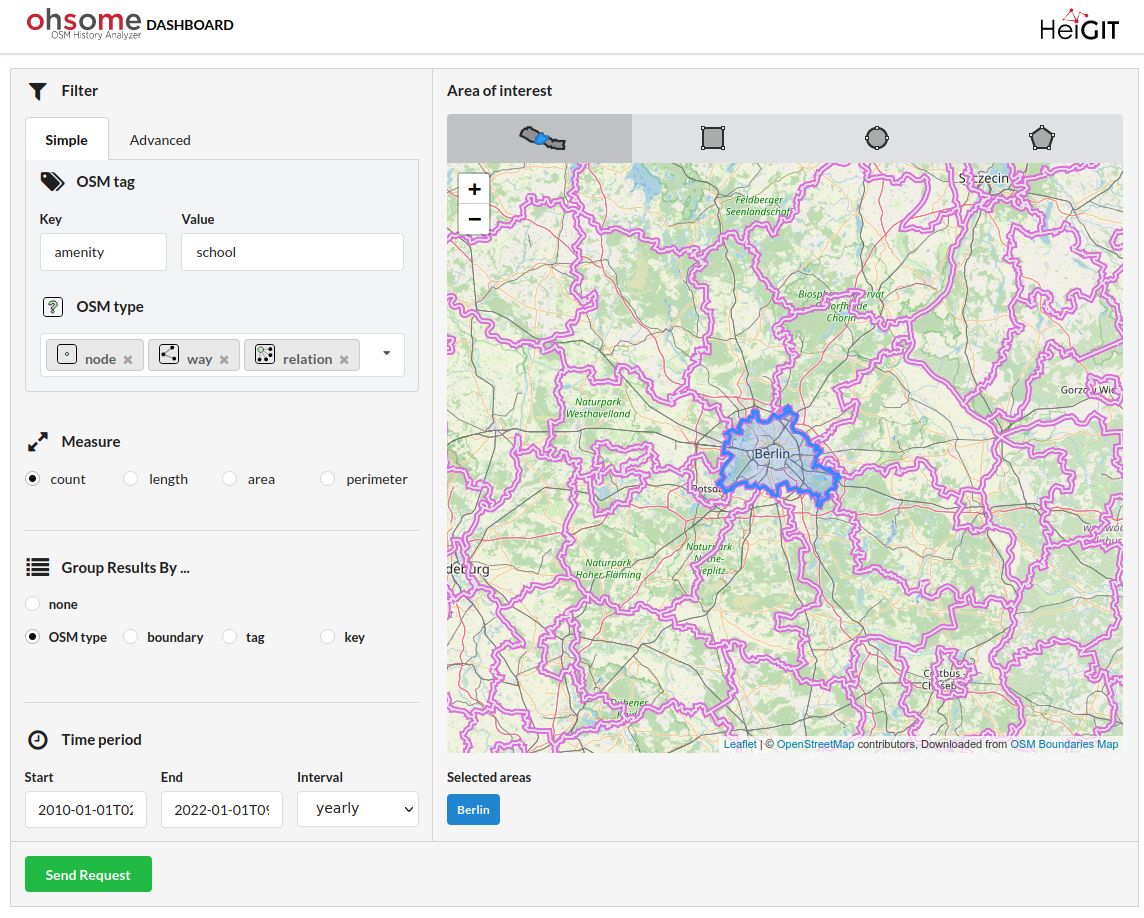
Go to https://ohsome.org/apps/dashboard/. Zoom to Berlin and select the boundary by clicking on the map. Define the query parameters in the ohsome dashboard, e.g. set the ohsome filter and make sure to group by OSM Type.
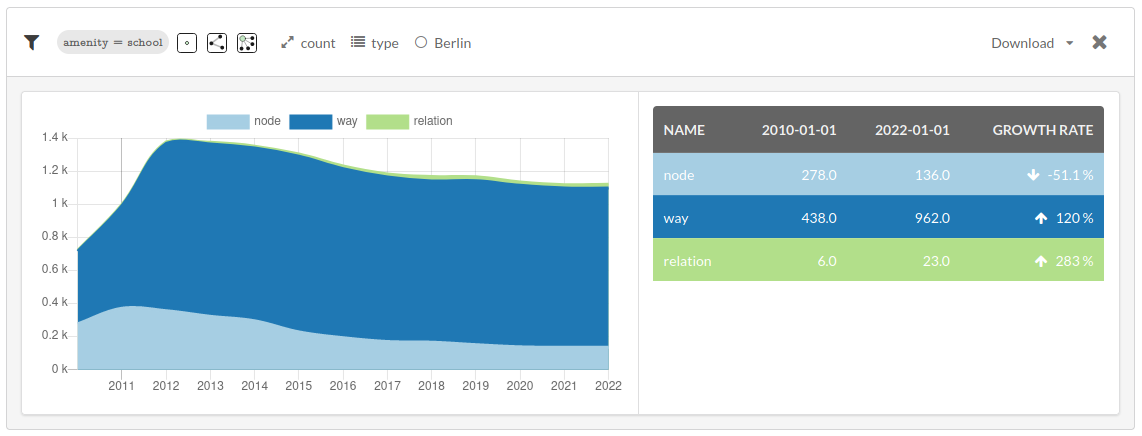
As of 2022-01-01 there were 136 nodes, 962 ways and 23 relations in Berlin tagged as amenity=school.
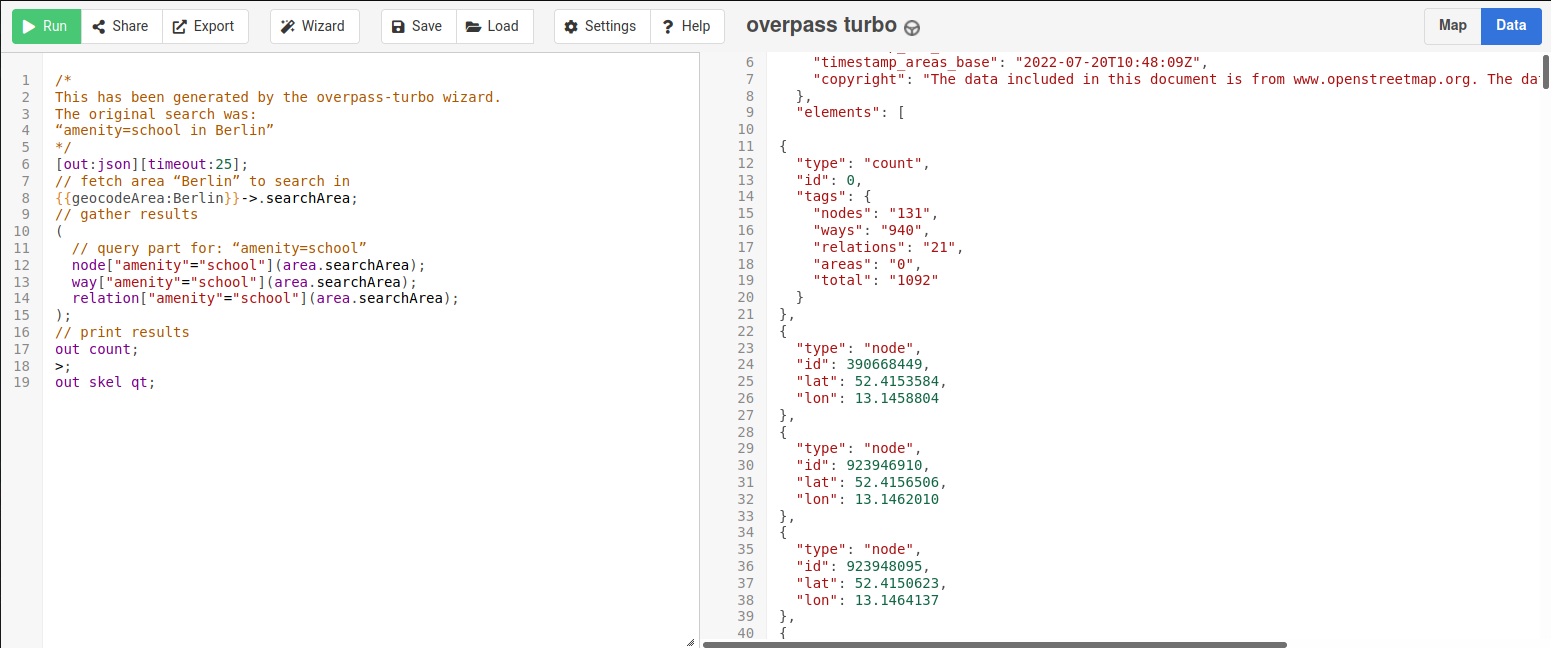
Go to: http://overpass-turbo.eu/. Zoom to Berlin and use the Query Wizard to define your request parameters. Make sure to use out count in your query.
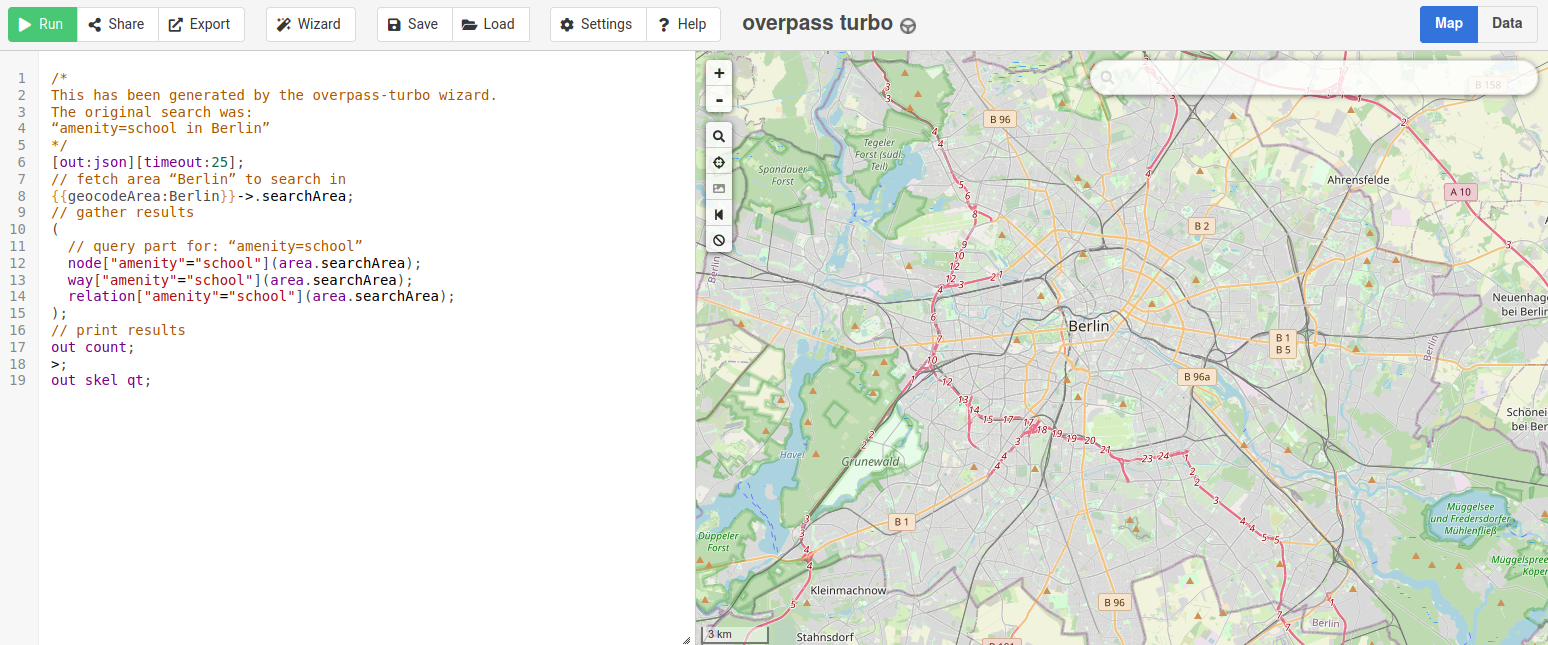
As of 2022-08-17 there were 131 nodes, 940 ways and 21 relations in Berlin tagged as amenity=school.
Note that the differences to the ohsome dashboard might arise from a) the different timestamp and b) the different region boundary utilized in the query.
3. Download Berlin’s district boundaries through OSM Boundaries#
Go to https://osm-boundaries.com/ and authenticate with your OSM account. Use the navigation on the left side (Germany –> Berlin) and select Berlin’s district boundaries.
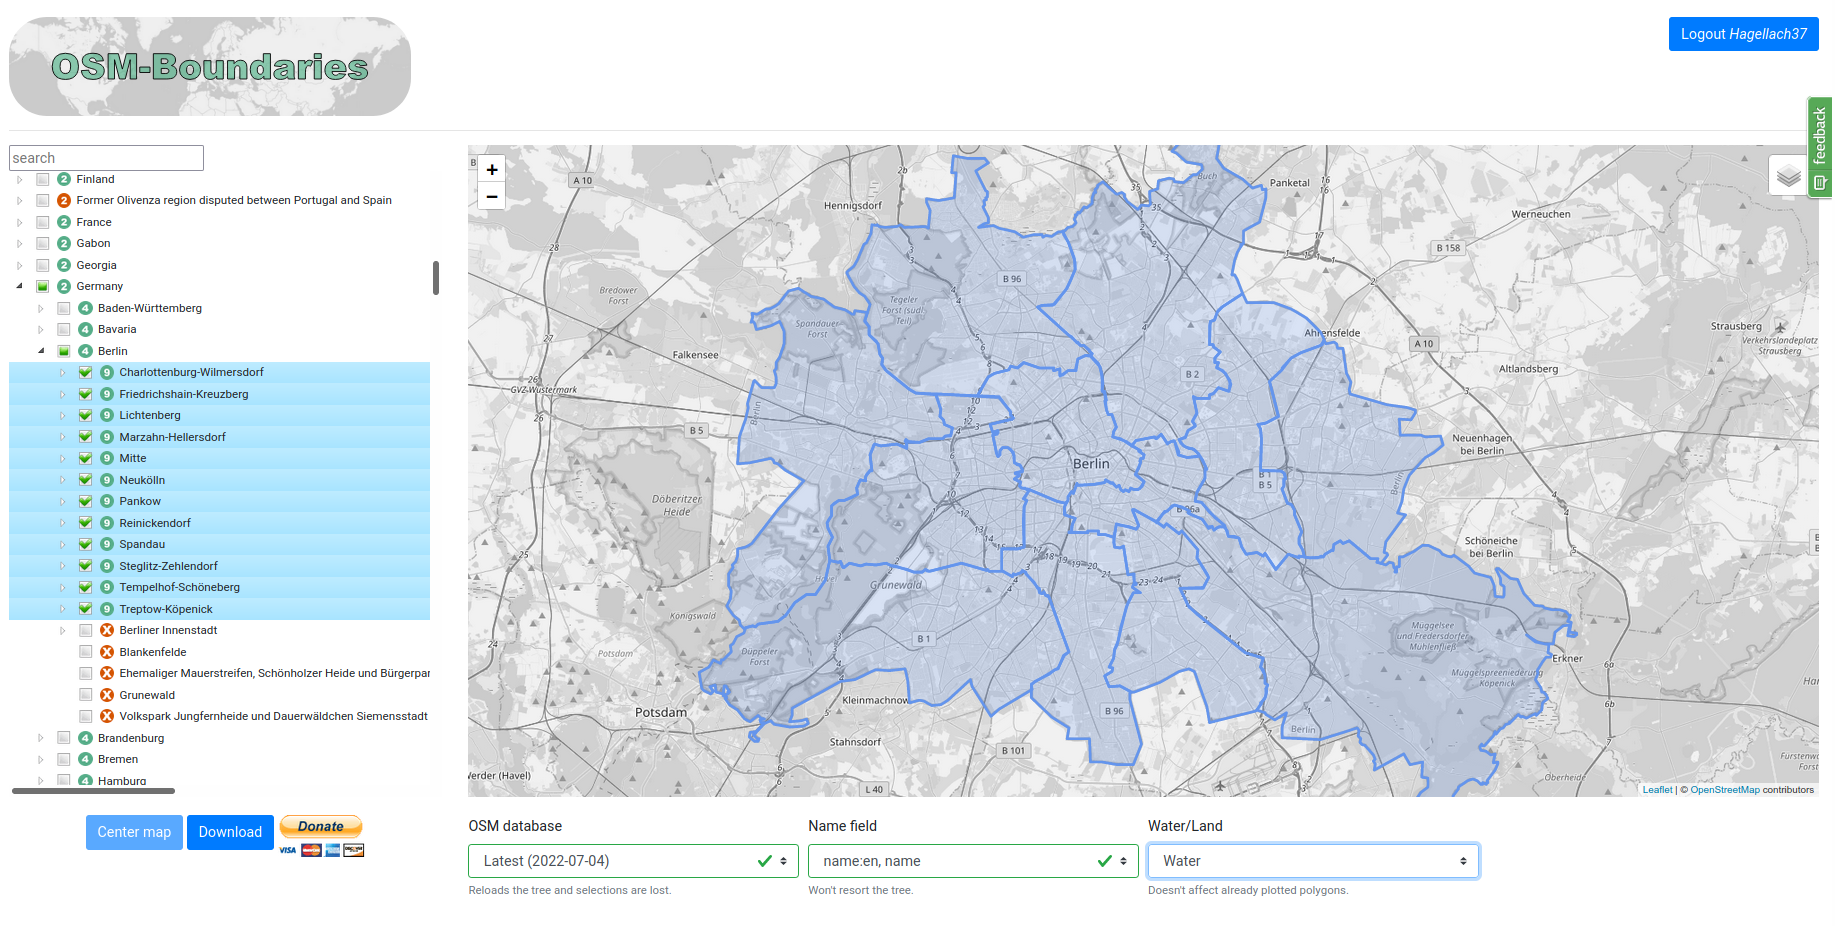
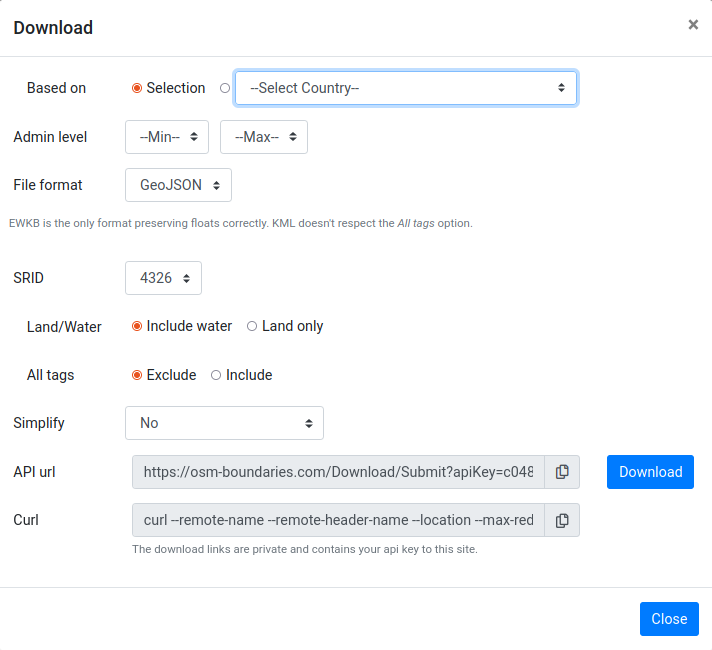
Click on “Download” and get your the boundaries as geojson file based on your selection. Make sure to unzip this .gz file!
4. Use QGIS to count schools per district#
Make sure that you have installed the QuickOSM Plugin for QGIS. Open the district boundaries geojson file in QGIS as well.
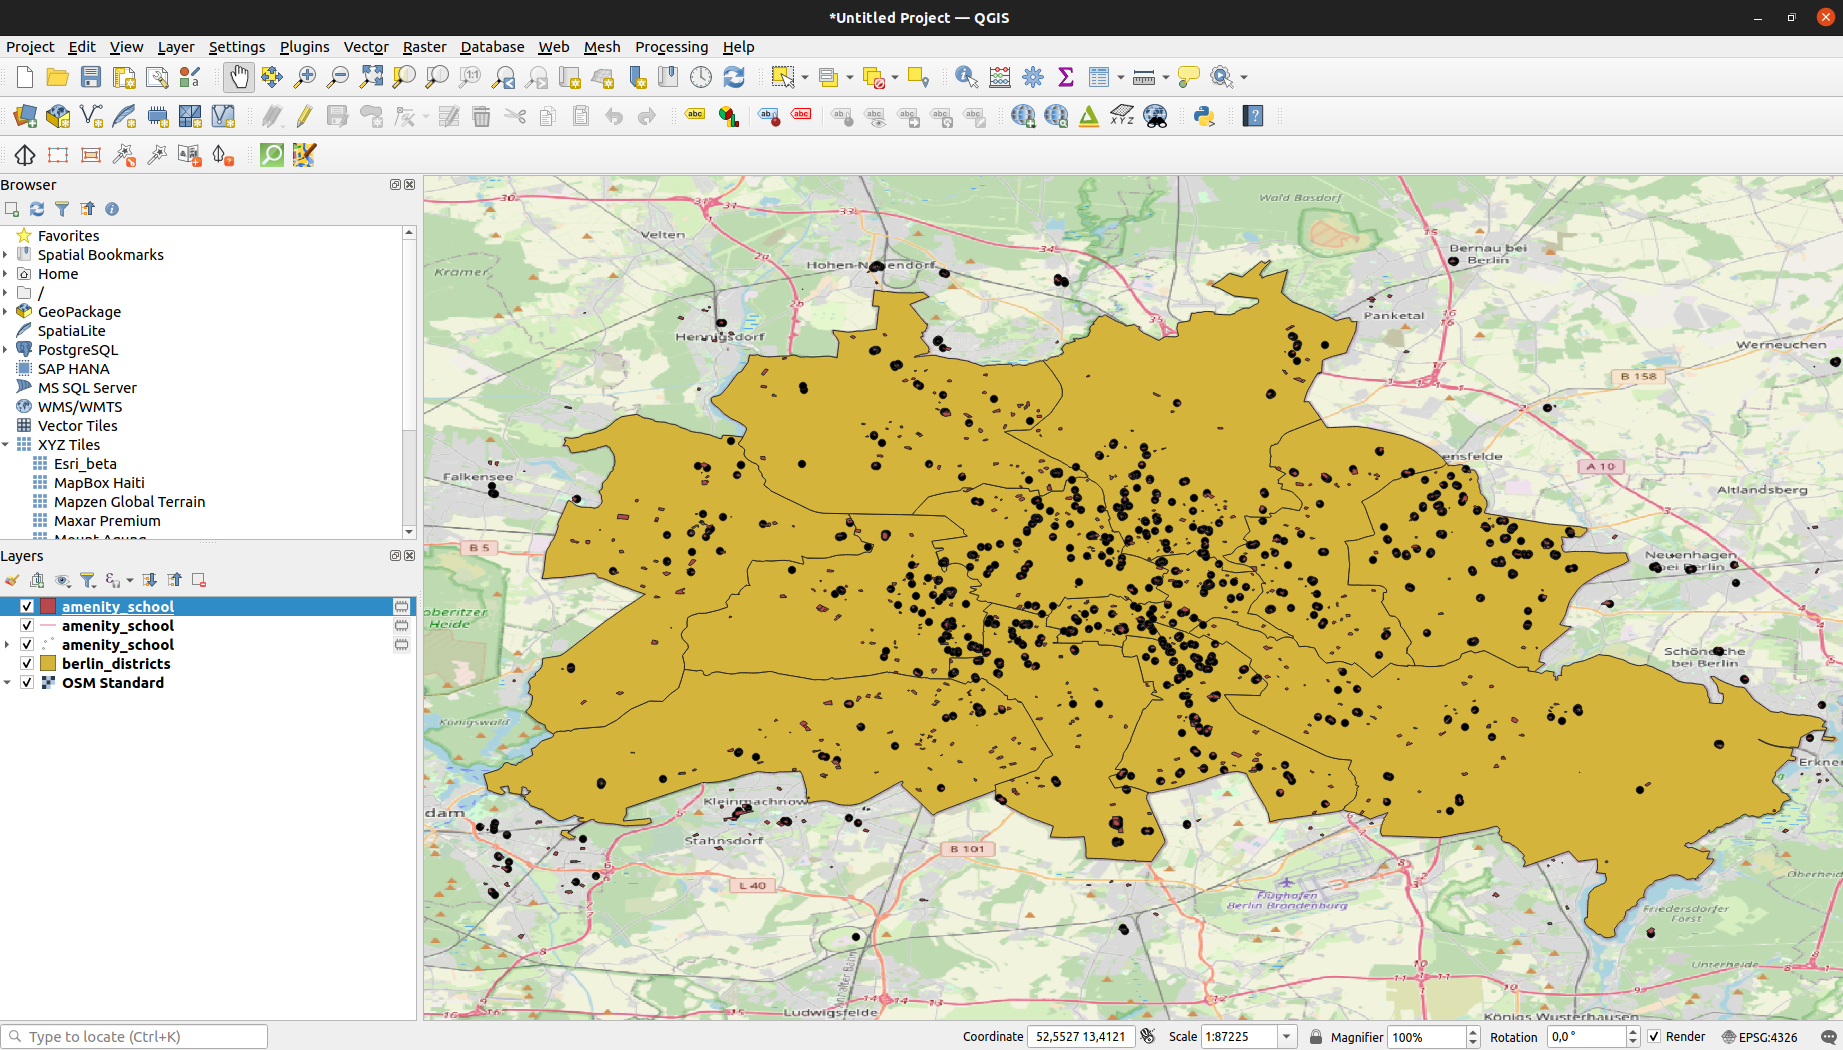
Download OSM data using the QuickOSM plugin. This should give you something like this:
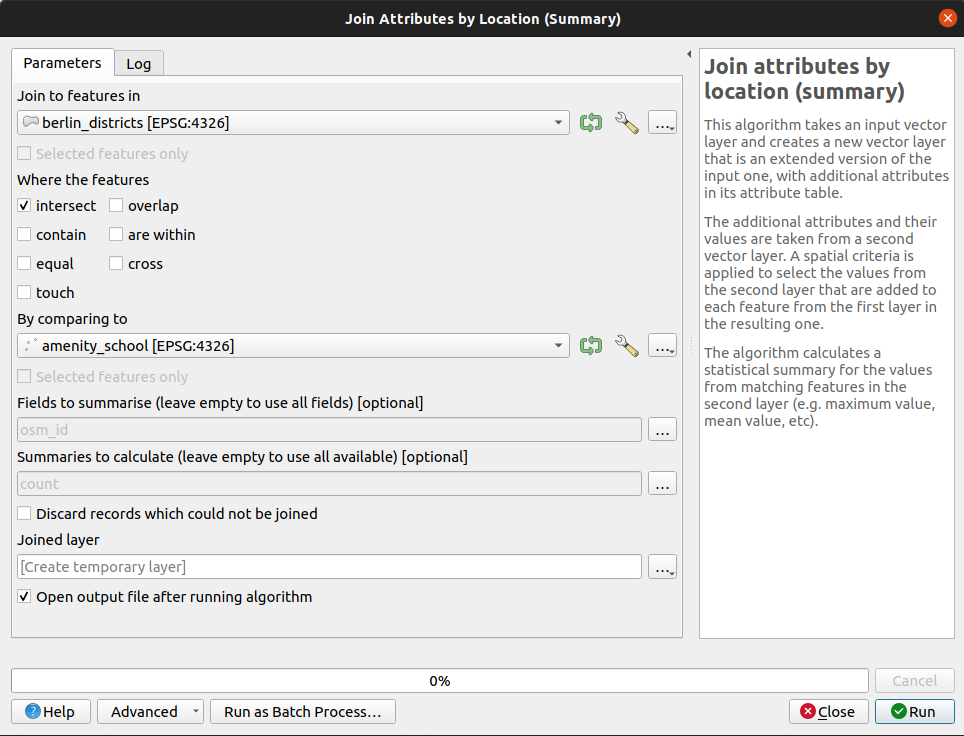
Use the Join by Location (Summary) tool in QGIS to count the number of schools per district. Choose osm_id as field to summarise and count as summaries to calculate. Do this analysis for two OSM layers (points, polygons). Afterwards consider renaming the generated attributes to something more useful, e.g. use polygon_count and point_count.
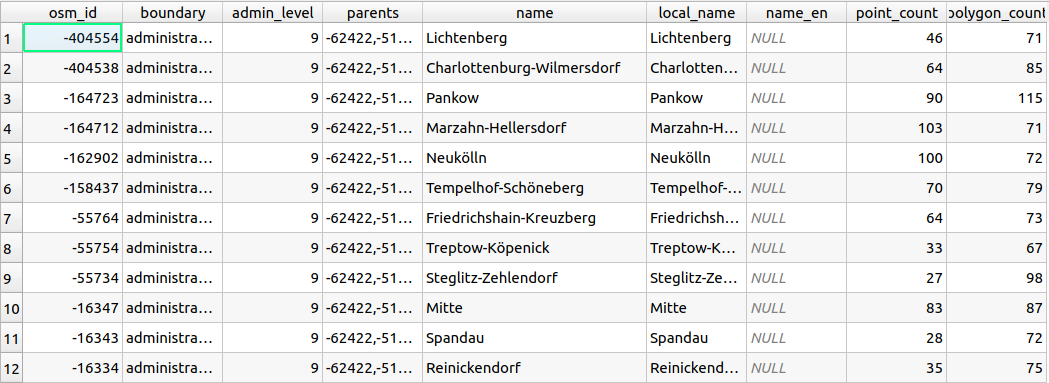
The attribute table of your resulting table should look like this:
5. Compare your results against an “official” number#
Research how many schools there are in Berlin using an official data source and compare with your OSM-based results.
You could use this WFS to download data into QGIS: https://fbinter.stadt-berlin.de/fb/wfs/data/senstadt/s_schulen?REQUEST=GetCapabilities&SERVICE=wfs