Extraction, Statistics and Aggregation#
ohsome API#
The ohsome API lets you analyze the rich data source of the OpenStreetMap history. You can either perform analyses using a dashboard-like application, or use the ohsome API directly and work with its CSV, JSON or GeoJSON responses.
The ohsome dashboard allows custom filtering of all available OpenStreetMap tags and types and includes administrative boundaries, making the selection of search areas easier. This is a great way to get started with the functionality the ohsome api offers.
The ohsome-py package helps you extract and analyse OpenStreetMap history data using the ohsome API and Python. It handles queries to the ohsome API and converts its responses to Pandas and GeoPandas data frames to facilitate easy data handling and analysis.
It is important to understand that the ohsome API offers different endpoints, which will be suited for different types of analyses. The documentation describes the API endpoints and which parameters can be used. The main endpoints are:
Aggregation#
Elements Aggregation: Get area, count, length or perimeter for a specific set of OSM elements (filter) for a specific region (boundary) and for a specific point in time (snapshot)
User Aggregation: Get the count of OSM contributors that edited a specific set of OSM elements (filter) for a specific region (boundary) up to a specific point in time by considering the OSM history.
Contributions Aggregation: Get the count of the contributions for a specific set of OSM elements (filter) for a specific region (boundary) within a specific time range by considering the OSM history.
Extraction#
Elements Extraction: Get the state of OSM data at the given timestamp(s) (snapshot) as a GeoJSON feature collection where object geometries are returned as the given geometryType (geometry, bbox, or centroid).
Elements Full History Extraction: Get the full history of OSM data as a GeoJSON feature collection. All changes to matching OSM features are included with corresponding validFrom and validTo timestamps. This endpoint supports the same geometryType options as the /elements endpoint.
Contributions Extraction: Get the contributions for a specific set of OSM elements (filter) for a specific region (boundary) within a specific time range by considering the OSM history.
Metadata#
Metadata: Get metadata of the underlying OpenStreetMap History Database (OSHDB) data. Does not consume any parameters.
ohsome Dashboard#
Note
This section is mainly based on a workshop by Michael Auer, Matthias Schaub, Rafael Troilo and Benjamin Herfort at State of the Map 2022 and a blog post by Sarah Heidekorn.
The ohsome Dashboard generates accurate statistics about the historical development of OSM data for custom or predefined regions all over the world and relies on the ohsome API. No programming skills are needed to work with the dashboard. The ohsome Dashboard allows custom filtering of all available OpenStreetMap tags and types and includes administrative boundaries, making the selection of search areas easier. As a result you get a graphical view on the response values of your request.
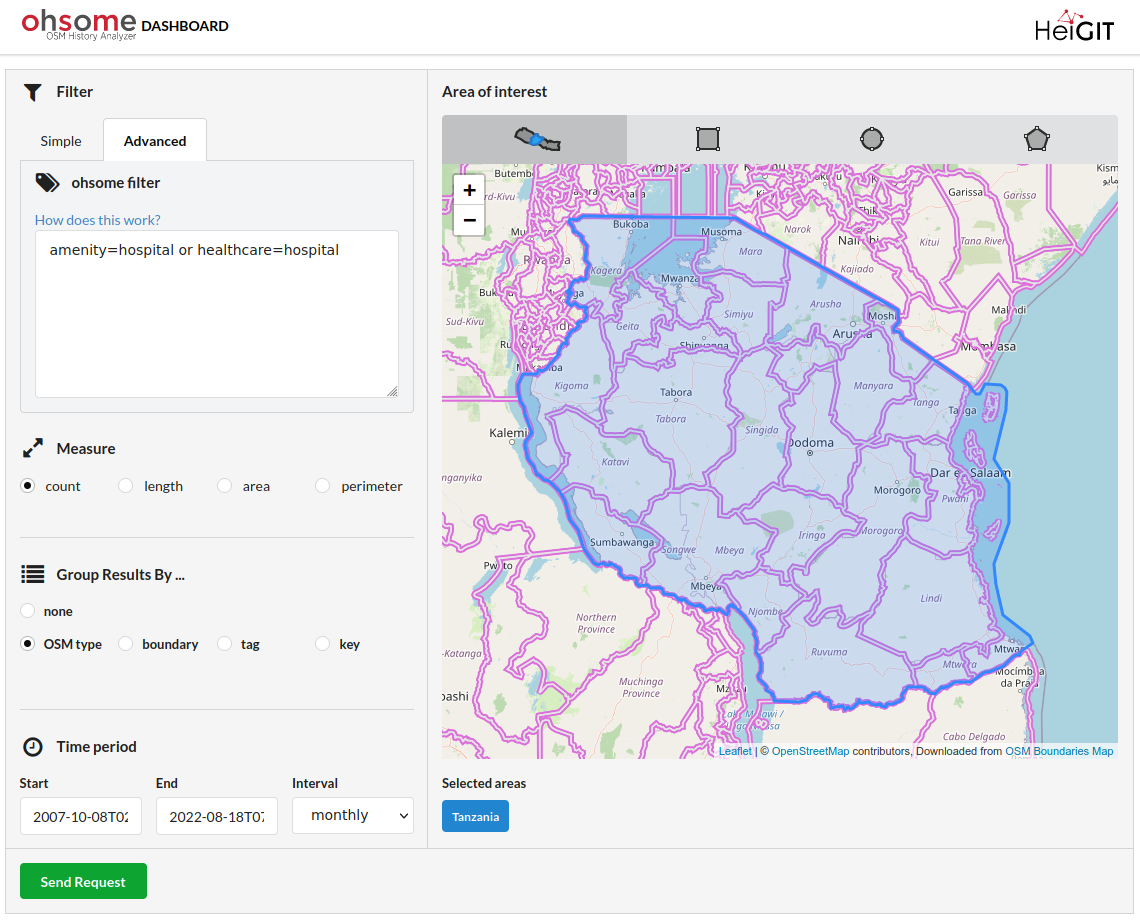
The ohsome dashboard’s main plus over directly querying the ohsome API is that it boasts more of an interface than other tools. All you have to do is tell the dashboard what you’d like, so there’s no need for you to get your input boundary file. Instead, simply use the map given on the right site of the interface. Then you can address which filter you would like to use as well as your temporal resolution of choice. Once you set the dashboard parameters to everything you need (e.g. groupBy) the only thing left to do is hit the “Send Request”-button and wait for your output data. Whilst the ohsome Dashboard will also display your output in a figure on the page itself, you can of course download your dataset to keep working on it as either an ohsome JSON or CSV file.
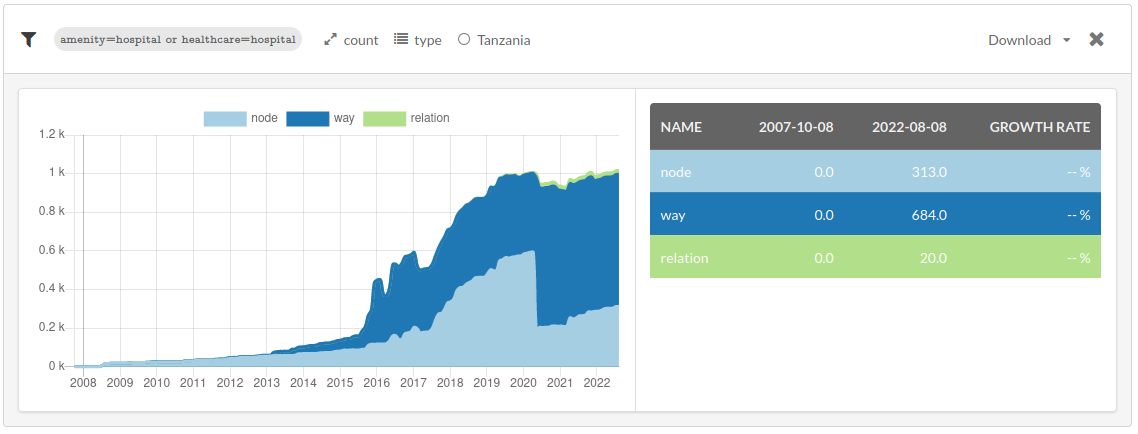
Here’s an example which investigates how detailed objects are mapped. The analysis compares different tagging schemes for hospitals in Tanzania. The following filter is used amenity=hospital or healthcare=hospital and results are grouped by OSM-Types.
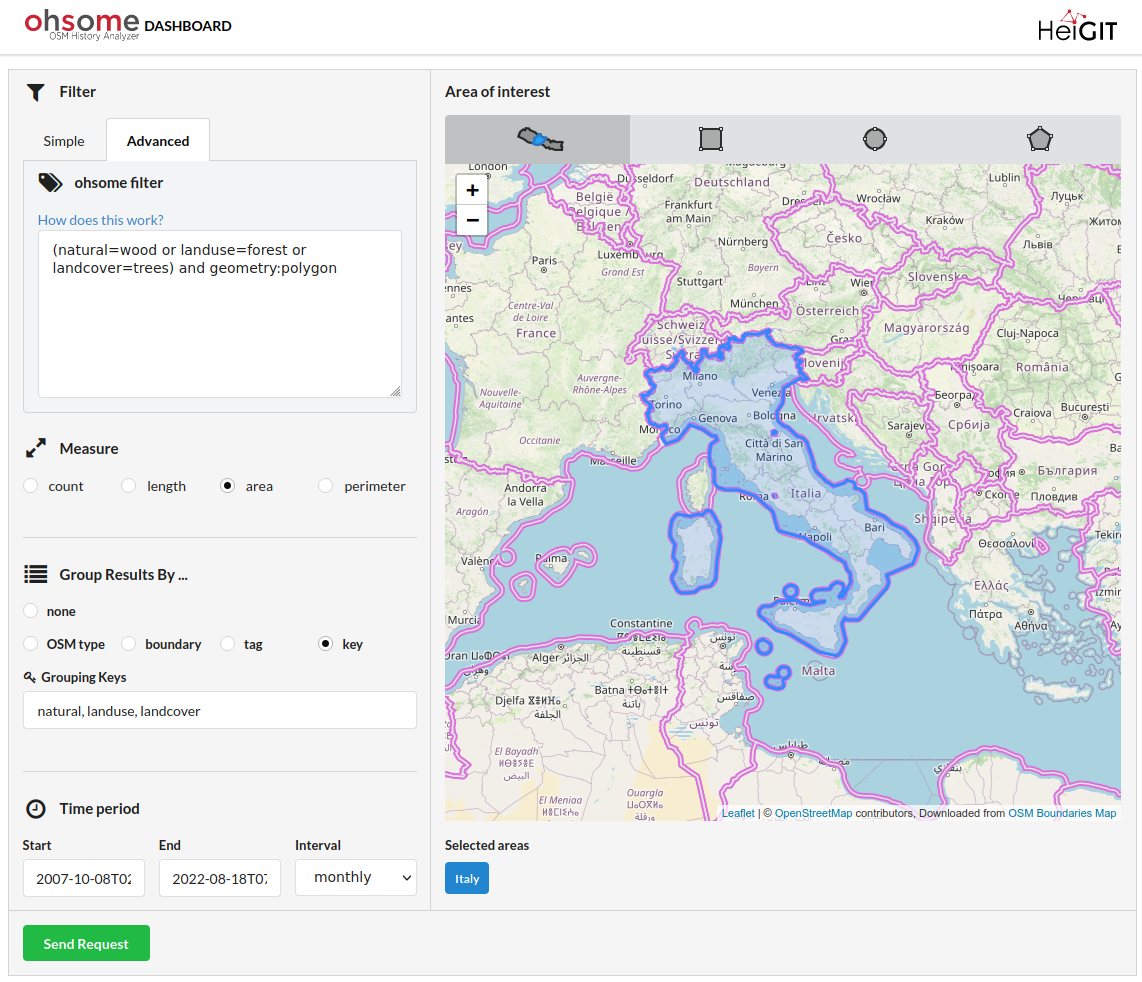
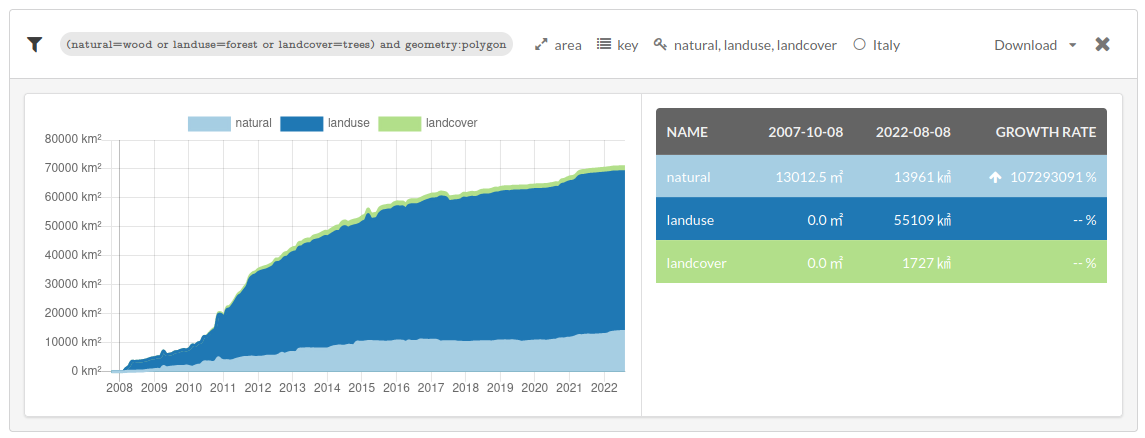
In another example we can check which tags are accepted by the community in Italy and compare forests tags grouped by keys. We use area based aggregation and the following filter (natural=wood or landuse=forest or landcover=trees) and geometry:polygon.
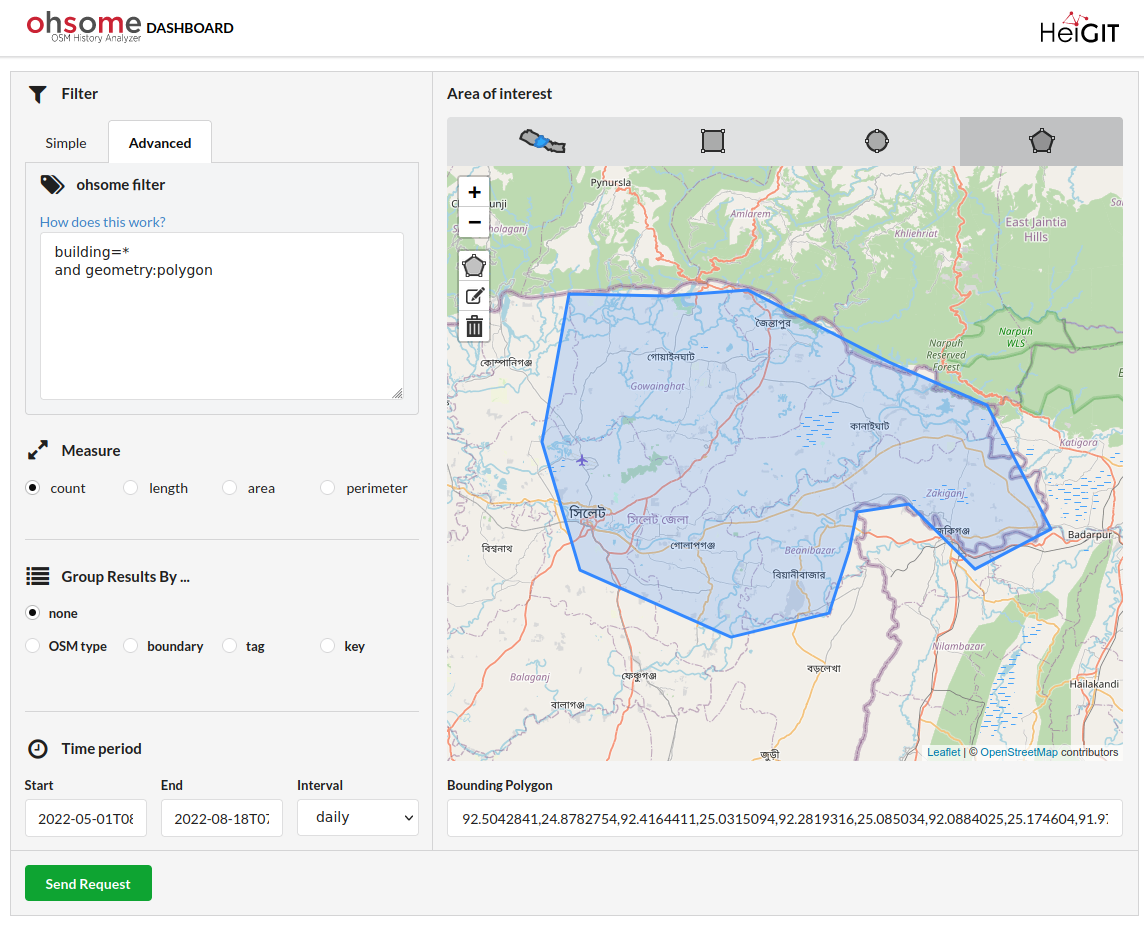
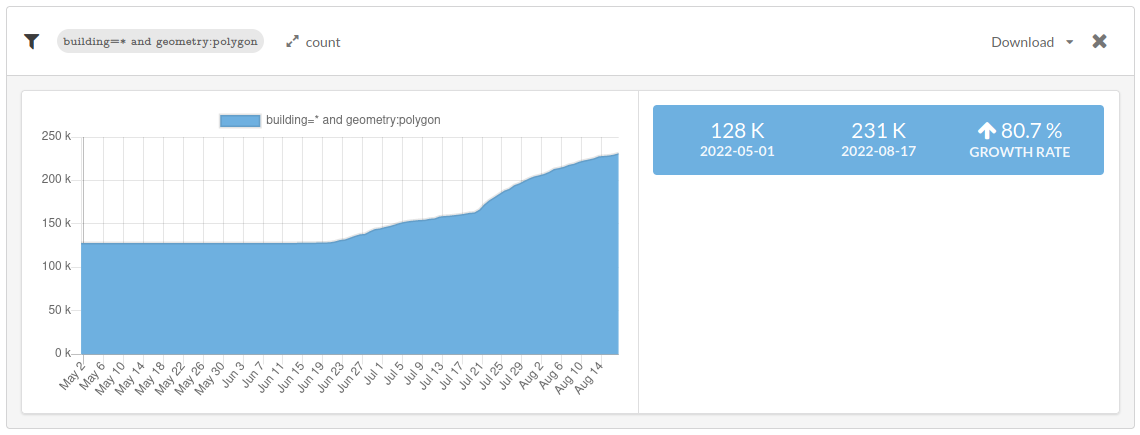
With the ohsome Dashboard you can also investigate progress for your mapping campaigns. In the example we count the buildings (building=* and geometry:polygon) mapped in the region of HOT Tasking Manager Project #12825 in Bangladesh. For this mapping campaign we use daily stats and provide a custom bounding polygon. In the dashboard you can move your pointer across the graph and get information as to the value on a certain date.
Example Queries#
Count number of elements#
Count the number of buildings as of 2014-01-01.
curl -X GET 'https://api.ohsome.org/v1/elements/area?bboxes=8.625%2C49.3711%2C8.7334%2C49.4397&format=json&time=2014-01-01&filter=building=*and%20type%3Away'
import requests
URL = 'https://api.ohsome.org/v1/elements/count'
data = {
    "bboxes": "8.625,49.3711,8.7334,49.4397",
    "format": "json",
    "time": "2014-01-01",
    "filter": "building=* and type:way"
}
response = requests.post(URL, data=data)
print(response.json())
Sum area of elements#
Get the total farmland area on an annual basis.
curl -X GET 'https://api.ohsome.org/v1/elements/area?bboxes=8.625%2C49.3711%2C8.7334%2C49.4397&format=json&time=2016-01-01/2022-01-01/P1Y&filter=landuse%3Dfarmland%20and%20type%3Away'
import requests
URL = 'https://api.ohsome.org/v1/elements/area'
data = {
    "bboxes": "8.625,49.3711,8.7334,49.4397",
    "format": "json",
    "time": "2016-01-01/2022-01-01/P1Y",
    "filter": "landuse=farmland and type:way"
}
response = requests.post(URL, data=data)
print(response.json())
Metadata#
Check when OSM data has been updated in the ohsome cluster.
curl -X GET 'https://api.ohsome.org/v1/metadata'
import requests
URL = 'https://api.ohsome.org/v1/metadata'
response = requests.get(URL)
print(response)